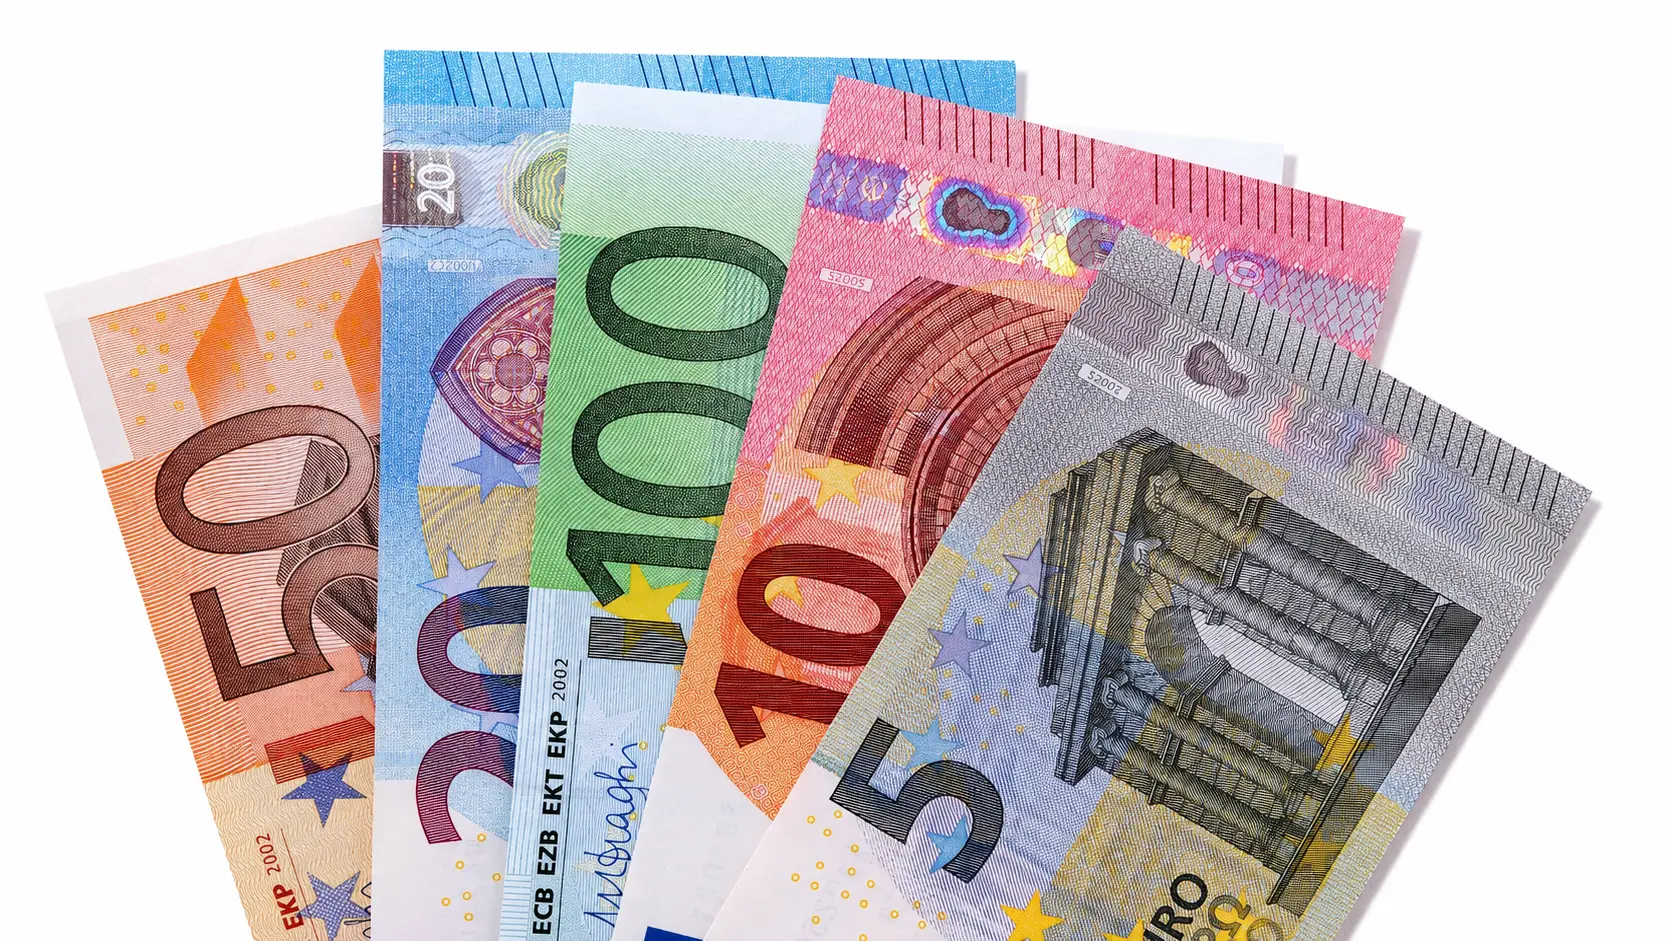
یورو در ماههای اخیر، بهویژه پس از آغاز جنگ ایران، در برابر دلار ضعیفتر شده است. بااینحال، این کاهش ارزش هنوز در محدودهای رخ داده که بیش از یک سال دوام آورده است. اکنون نمودارها نشان میدهند که یورو ممکن است به خروج از این محدوده نزدیک شده باشد؛ خروجی که میتواند مسیر بعدی این ارز را مشخص کند.
از آوریل ۲۰۲۵ تاکنون، نرخ یورو در برابر دلار میان دو میانگین متحرک بلندمدت نوسان کرده است: میانگین متحرک ۱۰۰ماهه در پایین نمودار نقش کف حمایتی را دارد و میانگین متحرک ۲۰۰ماهه در بالا مانند سقف مقاومتی عمل میکند.
میانگین متحرک، متوسط قیمت یک دارایی در یک دوره مشخص است. این شاخص نوسانهای کوتاهمدت را کنار میزند تا جهت کلی بازار بهتر دیده شود. بنابراین، وقتی قیمت میان دو میانگین متحرک گرفتار میشود، میتوان گفت بازار هنوز برای انتخاب مسیر صعودی یا نزولی به نتیجه روشنی نرسیده است.
:root{
–w2p-ink:#1e1e24;
–w2p-muted:#6b7280;
–w2p-grid:#d9dde3;
–w2p-line:#ff6b00;
–w2p-bg:#f7f5f1;
–w2p-card:#ffffff;
–w2p-accent:#ff6b00;
}
*{box-sizing:border-box}
.w2p-reuters-chart{
width:min(100%,1280px);
margin:24px auto;
background:var(–w2p-card);
border:1px solid #e5e7eb;
border-radius:18px;
overflow:hidden;
box-shadow:0 10px 28px rgba(0,0,0,.06);
font-family:Sahel,Vazirmatn,IRANSansX,Tahoma,Arial,sans-serif;
color:var(–w2p-ink);
}
.w2p-reuters-chart__inner{
padding:28px 26px 18px;
background:var(–w2p-bg);
}
.w2p-reuters-chart__title{
margin:0;
font-size:clamp(24px,3vw,42px);
line-height:1.3;
font-weight:900;
direction:rtl;
text-align:right;
}
.w2p-reuters-chart__subtitle{
margin:10px 0 0;
font-size:clamp(16px,1.7vw,24px);
color:#3f4651;
direction:rtl;
text-align:right;
}
.w2p-reuters-chart__canvas-wrap{
position:relative;
direction:ltr;
margin-top:18px;
}
#w2pReutersBreakoutCanvas{
display:block;
width:100%;
height:720px;
touch-action:pan-y;
}
.w2p-reuters-chart__footer{
display:flex;
align-items:center;
justify-content:space-between;
gap:12px;
padding:14px 24px 18px;
border-top:1px solid #eceff3;
font-size:14px;
color:#5f6773;
background:#fff;
direction:rtl;
}
.w2p-reuters-chart__footer strong{color:#2e3440}
.w2p-reuters-chart__button{
border:1px solid #d7dbe1;
background:#fff;
color:#1e1e24;
border-radius:10px;
padding:8px 14px;
font:inherit;
font-weight:700;
cursor:pointer;
}
.w2p-reuters-chart__button:hover{background:#f8fafc}
@media (max-width:900px){
#w2pReutersBreakoutCanvas{height:580px}
}
@media (max-width:640px){
.w2p-reuters-chart{margin:12px 0;border-radius:14px}
.w2p-reuters-chart__inner{padding:18px 12px 12px}
#w2pReutersBreakoutCanvas{height:480px}
.w2p-reuters-chart__footer{padding:12px;flex-direction:column;align-items:flex-start;font-size:12px}
}
یورو به شکست نزولی در برابر دلار نزدیکتر شده است
نرخ لحظهای یورو در برابر دلار آمریکا
(() => {
const canvas = document.getElementById(‘w2pReutersBreakoutCanvas’);
const replayBtn = document.getElementById(‘w2pBreakoutReplay’);
if(!canvas) return;
const ctx = canvas.getContext(‘2d’);
const C = {
ink:’#1e1e24′, muted:’#727986′, grid:’#d9dde3′, line:’#ff6b00′, bg:’#f7f5f1′, accent:’#ff6b00′
};
const faDigits = s => String(s).replace(/d/g, d => ‘۰۱۲۳۴۵۶۷۸۹'[d]);
const faNum = (v, n=2) => faDigits(Number(v).toFixed(n).replace(/.00$/,”).replace(‘.’, ‘٫’));
const anchors = [
[0,1.034],[3,1.029],[6,1.048],[10,1.032],[14,1.051],[17,1.040],
[20,1.091],[23,1.088],[26,1.078],[30,1.104],[32,1.098],[34,1.137],
[38,1.145],[42,1.111],[46,1.133],[50,1.142],[54,1.158],[58,1.178],
[62,1.163],[66,1.176],[68,1.148],[72,1.166],[78,1.168],[84,1.181],
[90,1.173],[96,1.160],[102,1.150],[108,1.162],[114,1.153],[120,1.176],
[126,1.179],[132,1.166],[136,1.205],[140,1.181],[145,1.190],[150,1.178],
[154,1.176],[158,1.144],[162,1.160],[166,1.146],[170,1.179],[176,1.170],
[182,1.177],[188,1.161],[194,1.164],[198,1.154],[202,1.159],[206,1.138],[210,1.143]
];
const totalPoints = 211;
const months = [
{i:0, label:[‘ژانویه’,’۲۰۲۵’]},
{i:38, label:[‘آوریل’,”]},
{i:76, label:[‘ژوئیه’,”]},
{i:114, label:[‘اکتبر’,”]},
{i:152, label:[‘ژانویه’,’۲۰۲۶’]},
{i:190, label:[‘آوریل’,”]},
{i:210, label:[‘ژوئیه’,”]},
];
function noise(i){
const x = Math.sin(i * 12.9898 + 78.233) * 43758.5453;
return (x – Math.floor(x)) – 0.5;
}
function interp(i){
if(i = anchors[anchors.length-1][0]) return anchors[anchors.length-1][1];
let a = anchors[0], b = anchors[1];
for(let k=1;k<anchors.length;k++){
if(i ({x:i, y:interp(i)}));
series[136].y = 1.2035;
series[210].y = 1.1400;
let progress = 1;
let raf = null;
let geom;
function roundRect(x,y,w,h,r){
const rr = Math.min(r, w/2, h/2);
ctx.beginPath();
ctx.moveTo(x+rr, y);
ctx.arcTo(x+w,y,x+w,y+h,rr);
ctx.arcTo(x+w,y+h,x,y+h,rr);
ctx.arcTo(x,y+h,x,y,rr);
ctx.arcTo(x,y,x+w,y,rr);
ctx.closePath();
}
function arrow(x1,y1,x2,y2){
const a = Math.atan2(y2-y1, x2-x1);
const size = 10;
ctx.beginPath();
ctx.moveTo(x1,y1);
ctx.lineTo(x2,y2);
ctx.stroke();
ctx.beginPath();
ctx.moveTo(x2,y2);
ctx.lineTo(x2-size*Math.cos(a-0.55), y2-size*Math.sin(a-0.55));
ctx.lineTo(x2-size*Math.cos(a+0.55), y2-size*Math.sin(a+0.55));
ctx.closePath();
ctx.fill();
}
function drawRtlLines(lines, rightX, centerY, gap){
const lineGap = gap || 22;
ctx.save();
ctx.direction = ‘rtl’;
ctx.textAlign = ‘right’;
ctx.textBaseline = ‘middle’;
const total = (lines.length – 1) * lineGap;
lines.forEach((line, idx) => {
ctx.fillText(‘’ + line, rightX, centerY – total / 2 + idx * lineGap);
});
ctx.restore();
}
function resize(){
const dpr = Math.max(1, window.devicePixelRatio || 1);
const rect = canvas.getBoundingClientRect();
canvas.width = rect.width * dpr;
canvas.height = rect.height * dpr;
ctx.setTransform(dpr,0,0,dpr,0,0);
draw();
}
function draw(){
const w = canvas.clientWidth;
const h = canvas.clientHeight;
ctx.clearRect(0,0,w,h);
const isMobile = w plot.x + ((i-xMin)/(xMax-xMin))*plot.w;
const Y = v => plot.y + ((yMax-v)/(yMax-yMin))*plot.h;
// grid + y axis labels
ctx.strokeStyle = C.grid;
ctx.lineWidth = 1;
ctx.fillStyle = ‘#8a9099′;
ctx.font = (isMobile?’16px’:’18px’) + ‘ Sahel, Tahoma’;
ctx.textAlign = ‘right’;
ctx.textBaseline = ‘middle’;
for(let val=1.04; val<=1.2401; val+=0.02){
const y = Y(val);
ctx.beginPath();
ctx.moveTo(plot.x, y);
ctx.lineTo(plot.x + plot.w, y);
ctx.stroke();
const label = (Math.abs(val-1.20) {
const x = X(t.i);
ctx.fillText(t.label[0], x, plot.y + plot.h + 16);
if(t.label[1]) ctx.fillText(faDigits(t.label[1]), x, plot.y + plot.h + 44);
});
// data line with animation
const visible = Math.max(2, Math.floor(series.length * progress));
ctx.save();
ctx.beginPath();
for(let i=0;i<visible;i++){
const p = series[i];
const x = X(p.x), y = Y(p.y);
if(i===0) ctx.moveTo(x,y); else ctx.lineTo(x,y);
}
ctx.strokeStyle = C.line;
ctx.lineWidth = isMobile?4:4.2;
ctx.lineJoin = 'round';
ctx.lineCap = 'round';
ctx.stroke();
ctx.restore();
if(progress {
const t = Math.min(1, (now-start)/duration);
progress = 1 – Math.pow(1-t, 3);
draw();
if(t < 1) raf = requestAnimationFrame(step);
};
raf = requestAnimationFrame(step);
}
window.addEventListener('resize', resize);
replayBtn?.addEventListener('click', animate);
resize();
animate();
})();
براساس دادههای LSEG، یورو تاکنون دو بار برای خروج از این محدوده تلاش کرده است؛ یک بار در مه ۲۰۲۵ و بار دیگر در ژانویه ۲۰۲۶. قیمت در هر دو مقطع از یکی از مرزهای دامنه عبور کرد، اما نتوانست تا پایان ماه بیرون آن باقی بماند و دوباره به داخل محدوده بازگشت. این رفتار نشان میدهد که کف و سقف فعلی هنوز قدرت زیادی دارند.
چرا احتمال شکست نزولی بیشتر است؟
میانگین متحرک ۲۰۰ماهه سقف این دامنه را تشکیل داده است. این شاخص بهدلیل پوشش قیمتی بیش از ۱۶ سال، تصویر بلندمدتتری از بازار ارائه میدهد و معمولاً عبور از آن دشوارتر است.
در سوی دیگر، میانگین متحرک ۱۰۰ماهه کف دامنه را مشخص میکند. این میانگین دوره کوتاهتری را پوشش میدهد و در مقایسه با میانگین ۲۰۰ماهه، مانع ضعیفتری به شمار میرود.
از آنجا که روند ماهانه یورو همچنان اندکی نزولی است، احتمال شکستهشدن کف دامنه بیشتر از عبور قیمت از سقف آن ارزیابی میشود. به بیان سادهتر، فشار فروش فعلاً بیشتر از نیروی لازم برای یک حرکت صعودی قدرتمند است.
در صورت افت یورو به زیر میانگین متحرک ۱۰۰ماهه و تثبیت قیمت در آن محدوده، هدف نزولی بعدی میتواند سطح ۱٫۰۹۴۰ دلار باشد.
این هدف با استفاده از «ابر ایچیموکو» به دست آمده است. ایچیموکو مجموعهای از شاخصهای تحلیلی است که معاملهگران از آن برای تشخیص جهت روند، قدرت حرکت قیمت و محدودههای احتمالی حمایت و مقاومت استفاده میکنند. در این نمودار، بخش پایینی ابر ایچیموکو محدوده ۱٫۰۹۴۰ دلار را بهعنوان حمایت بعدی نشان میدهد.
سناریوی صعودی همچنان ممکن است
احتمال حرکت صعودی یورو نیز کاملاً از بین نرفته است. کاهش انتظار بازار برای افزایش نرخ بهره فدرال رزرو میتواند دلار را تضعیف کند و به رشد یورو منجر شود.
نرخ بهره بالاتر معمولاً جذابیت دلار را برای سرمایهگذاران بیشتر میکند. در مقابل، اگر معاملهگران به این نتیجه برسند که فدرال رزرو دیگر نرخ بهره را افزایش نمیدهد، بخشی از حمایت بازار از دلار کاهش مییابد.
:root{
–w2p-ink:#1e1e24;
–w2p-muted:#68707a;
–w2p-grid:#e7e9ed;
–w2p-blue:#2f69e8;
–w2p-orange:#ff6b00;
–w2p-cloud:#b8b9bd;
–w2p-cloud-dark:#8d8f94;
–w2p-accent:#00a5b5;
–w2p-callout:#f4aba7;
–w2p-red:#ef4444;
–w2p-bg:#ffffff;
}
*{box-sizing:border-box}
body{margin:0;background:#f3f4f6;color:var(–w2p-ink);font-family:Sahel,Vazirmatn,IRANSansX,Tahoma,Arial,sans-serif}
.w2p-eurusd{
width:min(100%,1240px);
margin:24px auto;
background:var(–w2p-bg);
border:1px solid #e1e3e7;
border-radius:18px;
box-shadow:0 10px 30px rgba(20,25,35,.07);
overflow:hidden;
}
.w2p-eurusd__head{padding:26px 30px 12px;text-align:center}
.w2p-eurusd__eyebrow{margin:0 0 8px;color:var(–w2p-muted);font-size:13px;font-weight:700;letter-spacing:.02em}
.w2p-eurusd__title{margin:0;font-size:clamp(25px,3vw,42px);line-height:1.25;font-weight:900}
.w2p-eurusd__stats{margin:10px auto 0;color:#444b55;font-size:13px;line-height:1.9;direction:rtl}
.w2p-eurusd__legend{display:flex;flex-wrap:wrap;justify-content:center;gap:8px 14px;margin-top:12px;font-size:12px;color:#4a5059}
.w2p-eurusd__legend span{display:inline-flex;align-items:center;gap:6px;white-space:nowrap}
.w2p-eurusd__dot{width:10px;height:10px;border-radius:50%;display:inline-block}
.w2p-eurusd__canvas-wrap{position:relative;width:100%;padding:0 12px 4px;direction:ltr}
#w2pEurUsdCanvas{display:block;width:100%;height:650px;touch-action:pan-y}
.w2p-eurusd__tooltip{
position:absolute;z-index:5;pointer-events:none;opacity:0;transform:translate(-50%,-108%);
min-width:190px;padding:10px 12px;background:rgba(30,30,36,.96);color:#fff;border-radius:10px;
font-size:12px;line-height:1.8;text-align:right;direction:rtl;box-shadow:0 8px 22px rgba(0,0,0,.18);
transition:opacity .12s ease;
}
.w2p-eurusd__tooltip strong{font-size:13px}
.w2p-eurusd__footer{display:flex;align-items:center;justify-content:space-between;gap:12px;padding:10px 22px 18px;color:var(–w2p-muted);font-size:12px;border-top:1px solid #eceef1}
.w2p-eurusd__source{line-height:1.8}
.w2p-eurusd__button{border:1px solid #dadde2;background:#fff;color:var(–w2p-ink);border-radius:9px;padding:7px 12px;font:inherit;font-weight:700;cursor:pointer}
.w2p-eurusd__button:hover{background:#f5f6f8}
@media (max-width:640px){
.w2p-eurusd{margin:12px 0;border-radius:14px}
.w2p-eurusd__head{padding:20px 16px 8px}
.w2p-eurusd__title{font-size:26px}
.w2p-eurusd__stats{font-size:11px}
.w2p-eurusd__legend{font-size:11px;gap:6px 10px}
.w2p-eurusd__canvas-wrap{padding:0 4px}
#w2pEurUsdCanvas{height:520px}
.w2p-eurusd__footer{padding:10px 12px 14px;align-items:flex-start;flex-direction:column}
}
تحلیل تکنیکال بازار ارز
نمودار ماهانه یورو/دلار (EUR/USD)
آخرین شمع: بازشدن ۱٫۱۹۱۰ · اوج ۱٫۲۰۹۲ · کف ۱٫۱۷۱۷ · بستهشدن ۱٫۱۸۱۳ · تغییر ۰٫۸۱٪−
میانگین متحرک ۱۰۰ماهه
ابر ایچیموکو
شمع ماهانه
(() => {
const canvas = document.getElementById(‘w2pEurUsdCanvas’);
const tooltip = document.getElementById(‘w2pEurUsdTooltip’);
const replay = document.getElementById(‘w2pReplay’);
const ctx = canvas.getContext(‘2d’);
const C = {
ink:’#1e1e24′, muted:’#68707a’, grid:’#e7e9ed’, blue:’#2f69e8′, orange:’#ff6b00′,
cloud:’#b8b9bd’, cloudDark:’#8d8f94′, accent:’#00a5b5′, callout:’#f4aba7′, red:’#ef4444′, white:’#fff’
};
const faDigits = s => String(s).replace(/d/g, d => ‘۰۱۲۳۴۵۶۷۸۹'[d]);
const faNum = (v, n=4) => faDigits(Number(v).toFixed(n).replace(‘.’, ‘٫’));
const faYear = y => faDigits(y);
const monthNames = [‘ژانویه’,’فوریه’,’مارس’,’آوریل’,’مه’,’ژوئن’,’ژوئیه’,’اوت’,’سپتامبر’,’اکتبر’,’نوامبر’,’دسامبر’];
function monthIndex(y,m){ return (y-2017)*12 + (m-9); } // Sep 2017 = 0
function dateFromIndex(i){
const d = new Date(Date.UTC(2017,8+i,1));
return {year:d.getUTCFullYear(), month:d.getUTCMonth()};
}
const endIndex = monthIndex(2026,7);
const futureEnd = monthIndex(2029,1);
const anchorList = [
[2017,9,1.080],[2017,12,1.160],[2018,2,1.185],[2018,5,1.205],[2018,6,1.235],
[2018,9,1.175],[2018,12,1.145],[2019,3,1.120],[2019,6,1.135],[2019,9,1.100],
[2019,12,1.115],[2020,3,1.105],[2020,6,1.120],[2020,8,1.185],[2020,11,1.180],
[2021,1,1.220],[2021,3,1.190],[2021,5,1.215],[2021,7,1.180],[2021,10,1.155],
[2022,1,1.135],[2022,4,1.080],[2022,7,0.980],[2022,9,1.035],[2022,12,1.085],
[2023,3,1.105],[2023,6,1.090],[2023,9,1.105],[2023,12,1.085],
[2024,3,1.095],[2024,6,1.080],[2024,9,1.105],[2024,12,1.070],
[2025,2,1.040],[2025,4,1.090],[2025,6,1.165],[2025,8,1.175],[2025,10,1.165],[2025,12,1.180],
[2026,1,1.195],[2026,3,1.175],[2026,5,1.180],[2026,7,1.1813]
].map(d => ({i:monthIndex(d[0],d[1]), v:d[2]}));
function seededNoise(i){
const x = Math.sin(i*12.9898 + 78.233) * 43758.5453;
return (x – Math.floor(x)) – .5;
}
function interpAnchors(i, anchors){
if(i = anchors[anchors.length-1].i) return anchors[anchors.length-1].v;
let a=anchors[0], b=anchors[1];
for(let k=1;k<anchors.length;k++){
if(i <= anchors[k].i){ a=anchors[k-1]; b=anchors[k]; break; }
}
const t=(i-a.i)/(b.i-a.i);
const s=t*t*(3-2*t);
return a.v + (b.v-a.v)*s;
}
const candles=[];
let prevClose=1.078;
for(let i=0;i({i:monthIndex(d[0],d[1]),v:d[2]}));
const ma100Anchors = [
[2017,9,1.282],[2018,12,1.245],[2019,10,1.220],[2020,12,1.180],[2021,10,1.145],[2022,9,1.128],[2024,2,1.119],[2025,7,1.124],[2026,7,1.120671]
].map(d=>({i:monthIndex(d[0],d[1]),v:d[2]}));
function seriesFromAnchors(anchors, start=0, end=endIndex){
const out=[];
for(let i=start;i({i:monthIndex(d[0],d[1]),v:d[2]}));
const cloudBottomAnchors = [
[2017,9,1.255],[2018,2,1.205],[2018,8,1.170],[2019,4,1.115],[2019,9,1.095],
[2020,4,1.105],[2020,10,1.160],[2021,5,1.145],[2022,1,1.135],[2022,7,1.120],
[2023,3,1.145],[2023,10,1.150],[2024,5,1.120],[2024,10,1.085],[2025,4,1.065],
[2026,1,1.085],[2026,8,1.060],[2027,6,1.0806],[2028,2,1.0806],[2028,8,1.0806]
].map(d=>({i:monthIndex(d[0],d[1]),v:d[2]}));
const cloudStart=0, cloudEnd=monthIndex(2028,8);
const cloudTop=seriesFromAnchors(cloudTopAnchors,cloudStart,cloudEnd);
const cloudBottom=seriesFromAnchors(cloudBottomAnchors,cloudStart,cloudEnd);
let geometry=null;
let animationProgress=1;
let animationFrame=null;
function roundedRect(x,y,w,h,r){
const rr=Math.min(r,w/2,h/2);
ctx.beginPath();
ctx.moveTo(x+rr,y); ctx.arcTo(x+w,y,x+w,y+h,rr); ctx.arcTo(x+w,y+h,x,y+h,rr);
ctx.arcTo(x,y+h,x,y,rr); ctx.arcTo(x,y,x+w,y,rr); ctx.closePath();
}
function drawArrow(x1,y1,x2,y2,color,width=1.8){
ctx.save(); ctx.strokeStyle=color; ctx.fillStyle=color; ctx.lineWidth=width;
ctx.beginPath(); ctx.moveTo(x1,y1); ctx.lineTo(x2,y2); ctx.stroke();
const a=Math.atan2(y2-y1,x2-x1), size=8;
ctx.beginPath();
ctx.moveTo(x2,y2);
ctx.lineTo(x2-size*Math.cos(a-.55),y2-size*Math.sin(a-.55));
ctx.lineTo(x2-size*Math.cos(a+.55),y2-size*Math.sin(a+.55));
ctx.closePath(); ctx.fill(); ctx.restore();
}
function drawCallout(lines, bx, by, targetX, targetY, compact=false){
ctx.save();
const font=compact?’700 11px Sahel, Tahoma’:’700 13px Sahel, Tahoma’;
ctx.font=font;
const padX=12,padY=9,lineH=compact?17:20;
const widths=lines.map(t=>ctx.measureText(t).width);
const w=Math.max(…widths)+padX*2, h=lines.length*lineH+padY*2-4;
ctx.fillStyle=C.callout; ctx.strokeStyle=C.accent; ctx.lineWidth=1.4;
roundedRect(bx,by,w,h,10); ctx.fill(); ctx.stroke();
ctx.fillStyle=C.ink; ctx.textAlign=’center’; ctx.textBaseline=’middle’;
lines.forEach((t,k)=>ctx.fillText(t,bx+w/2,by+padY+lineH*(k+.45)));
const sx = targetX > bx+w/2 ? bx+w : bx;
const sy = by+h*.68;
drawArrow(sx,sy,targetX,targetY,C.accent,1.5);
ctx.restore();
return {w,h};
}
function drawLine(series, x, y, color, width, progress=1){
const maxI=Math.floor(endIndex*progress);
ctx.save(); ctx.strokeStyle=color; ctx.lineWidth=width; ctx.lineJoin=’round’; ctx.lineCap=’round’;
ctx.beginPath();
let started=false;
for(const p of series){
if(p.i>maxI) break;
if(!started){ctx.moveTo(x(p.i),y(p.v));started=true}else ctx.lineTo(x(p.i),y(p.v));
}
ctx.stroke(); ctx.restore();
}
function draw(){
const rect=canvas.getBoundingClientRect();
const cssW=Math.max(320,rect.width);
const cssH=cssW<640?520:Math.min(690,Math.max(560,cssW*.56));
canvas.style.height=cssH+'px';
const dpr=Math.min(window.devicePixelRatio||1,2);
canvas.width=Math.round(cssW*dpr); canvas.height=Math.round(cssH*dpr);
ctx.setTransform(dpr,0,0,dpr,0,0);
ctx.clearRect(0,0,cssW,cssH);
const mobile=cssWm.l+(i/futureEnd)*w;
const y=v=>m.t+(yMax-v)/(yMax-yMin)*h;
geometry={m,w,h,x,y,cssW,cssH,mobile};
ctx.fillStyle=’#fff’; ctx.fillRect(0,0,cssW,cssH);
// شبکه افقی و برچسب محور قیمت
ctx.textBaseline=’middle’; ctx.font=`${mobile?10:12}px Sahel,Tahoma`; ctx.textAlign=’left’;
for(let v=.90;v<=1.3501;v+=.05){
const yy=y(v);
ctx.strokeStyle=C.grid; ctx.lineWidth=1; ctx.beginPath(); ctx.moveTo(m.l,yy); ctx.lineTo(cssW-m.r,yy); ctx.stroke();
ctx.fillStyle=C.muted; ctx.fillText(faNum(v,2),cssW-m.r+8,yy);
}
// محور زمان
ctx.textAlign='center'; ctx.textBaseline='top';
const step=mobile?2:1;
for(let yr=2019;yr{const xx=x(p.i),yy=y(p.v); k?ctx.lineTo(xx,yy):ctx.moveTo(xx,yy)});
for(let k=cloudBottom.length-1;k>=0;k–){const p=cloudBottom[k];ctx.lineTo(x(p.i),y(p.v));}
ctx.closePath(); ctx.fillStyle=’rgba(165,166,171,.62)’; ctx.fill();
ctx.strokeStyle=C.ink;ctx.lineWidth=1.1;
ctx.beginPath();cloudTop.forEach((p,k)=>k?ctx.lineTo(x(p.i),y(p.v)):ctx.moveTo(x(p.i),y(p.v)));ctx.stroke();
ctx.beginPath();cloudBottom.forEach((p,k)=>k?ctx.lineTo(x(p.i),y(p.v)):ctx.moveTo(x(p.i),y(p.v)));ctx.stroke();
ctx.restore();
// خطوط میانگین متحرک
drawLine(ma200,x,y,C.blue,mobile?2:3,animationProgress);
drawLine(ma100,x,y,C.orange,mobile?2:3,animationProgress);
// شمعها
const visibleMax=Math.floor(endIndex*animationProgress);
const candleW=Math.max(2.4,Math.min(8,(w/futureEnd)*.66));
for(const d of candles){
if(d.i>visibleMax) break;
const xx=x(d.i), yo=y(d.open), yc=y(d.close), yh=y(d.high), yl=y(d.low);
const down=d.close<d.open;
ctx.strokeStyle=C.ink;ctx.lineWidth=1;
ctx.beginPath();ctx.moveTo(xx,yh);ctx.lineTo(xx,yl);ctx.stroke();
const top=Math.min(yo,yc), bh=Math.max(1.5,Math.abs(yc-yo));
ctx.fillStyle=down?'#55575b':'#fff';ctx.strokeStyle=C.ink;
ctx.fillRect(xx-candleW/2,top,candleW,bh);ctx.strokeRect(xx-candleW/2,top,candleW,bh);
}
// نشانگرهای عددی سمت راست
function badge(v,text,color){
const yy=y(v), bx=cssW-m.r+2, bw=m.r-6, bh=22;
ctx.fillStyle=color; roundedRect(bx,yy-bh/2,bw,bh,3); ctx.fill();
ctx.fillStyle='#fff'; ctx.font=`700 ${mobile?9:11}px Arial`;ctx.textAlign='center';ctx.textBaseline='middle';ctx.fillText(text,bx+bw/2,yy);
}
badge(1.186319,'1.1863',C.blue);
badge(1.120671,'1.1207',C.orange);
badge(1.0940,'1.0940',C.ink);
// توضیحات و پیکانها
const compact=mobile;
if(!mobile){
drawCallout(['میانگین متحرک ۲۰۰ماهه'],x(monthIndex(2023,7)),y(1.275),x(monthIndex(2025,4)),y(1.202),compact);
drawCallout(['میانگین متحرک ۱۰۰ماهه'],x(monthIndex(2023,1)),y(1.215),x(monthIndex(2024,12)),y(1.121),compact);
drawCallout(['اوج ژانویه: ۱٫۲۰۸۴'],x(monthIndex(2024,9)),y(1.245),x(monthIndex(2026,1)),y(1.2084),compact);
}else{
drawCallout(['۲۰۰ماهه'],x(monthIndex(2023,1)),y(1.285),x(monthIndex(2025,4)),y(1.202),true);
drawCallout(['۱۰۰ماهه'],x(monthIndex(2022,10)),y(1.215),x(monthIndex(2024,12)),y(1.121),true);
drawCallout(['اوج ژانویه','۱٫۲۰۸۴'],x(monthIndex(2024,8)),y(1.255),x(monthIndex(2026,1)),y(1.2084),true);
}
const sx=x(endIndex), sy=y(last.close), tx=x(monthIndex(2027,1)), ty=y(1.0940);
drawArrow(sx+3,sy+5,tx,ty,C.red,mobile?1.5:2);
ctx.fillStyle=C.ink;ctx.font=`800 ${mobile?11:15}px Sahel,Tahoma`;ctx.textAlign='center';ctx.textBaseline='bottom';
ctx.fillText('هدف ۱٫۰۹۴۰ = سقف ابر',x(monthIndex(2026,4)),y(1.092));
// منبع داخل نمودار
ctx.fillStyle=C.ink;ctx.font=`700 ${mobile?10:12}px Sahel,Tahoma`;ctx.textAlign='left';ctx.textBaseline='alphabetic';
ctx.fillText('منبع: LSEG',m.l+6,cssH-m.b-12);
}
function replayAnimation(){
if(animationFrame) cancelAnimationFrame(animationFrame);
const reduce=window.matchMedia('(prefers-reduced-motion: reduce)').matches;
if(reduce){animationProgress=1;draw();return;}
animationProgress=0;
const start=performance.now(),duration=1800;
function tick(now){
animationProgress=Math.min(1,(now-start)/duration);
animationProgress=1-Math.pow(1-animationProgress,3);
draw();
if(animationProgress<1) animationFrame=requestAnimationFrame(tick);
}
animationFrame=requestAnimationFrame(tick);
}
function pointerInfo(clientX,clientY){
if(!geometry) return;
const r=canvas.getBoundingClientRect();
const px=clientX-r.left, py=clientY-r.top;
const {m,w,x,y,cssW,cssH}=geometry;
if(pxcssW-m.r||pycssH-m.b){tooltip.style.opacity=0;return;}
let i=Math.round(((px-m.l)/w)*futureEnd);
i=Math.max(0,Math.min(endIndex,i));
const d=candles[i];
const cx=x(i), cy=y(d.high);
tooltip.innerHTML=`${monthNames[d.month]} ${faYear(d.year)}
بازشدن: ${faNum(d.open)}
اوج: ${faNum(d.high)}
کف: ${faNum(d.low)}
بستهشدن: ${faNum(d.close)}`;
tooltip.style.left=(cx+12)+’px’;
tooltip.style.top=(Math.max(95,cy))+’px’;
tooltip.style.opacity=1;
}
canvas.addEventListener(‘mousemove’,e=>pointerInfo(e.clientX,e.clientY));
canvas.addEventListener(‘mouseleave’,()=>tooltip.style.opacity=0);
canvas.addEventListener(‘touchstart’,e=>{const t=e.touches[0];pointerInfo(t.clientX,t.clientY)},{passive:true});
canvas.addEventListener(‘touchmove’,e=>{const t=e.touches[0];pointerInfo(t.clientX,t.clientY)},{passive:true});
replay.addEventListener(‘click’,replayAnimation);
const ro=new ResizeObserver(()=>draw());
ro.observe(canvas.parentElement);
replayAnimation();
})();
در چنین شرایطی، یورو ممکن است از میانگین متحرک ۲۰۰ماهه عبور کند. تثبیت نرخ بالاتر از این سطح میتواند نشانه ورود یورو به یک دامنه قیمتی بالاتر باشد. در این سناریو، اوج ژانویه در سطح ۱٫۲۰۸۴ دلار به هدف بعدی تبدیل خواهد شد.
نمودار چه میگوید؟
یورو از آوریل ۲۰۲۵ تاکنون میان میانگینهای متحرک ۱۰۰ماهه و ۲۰۰ماهه محصور مانده است. دو تلاش قبلی برای خروج از این محدوده در مه ۲۰۲۵ و ژانویه ۲۰۲۶ موفق نبود.
در حال حاضر، دو سناریو پیش روی بازار قرار دارد:
شکست کف دامنه میتواند یورو را به سمت ۱٫۰۹۴۰ دلار هدایت کند. در مقابل، عبور و تثبیت بالاتر از میانگین متحرک ۲۰۰ماهه میتواند مسیر صعود تا سطح ۱٫۲۰۸۴ دلار را باز کند.
با توجه به فشار نزولی ماههای اخیر، سناریوی اول فعلاً محتملتر به نظر میرسد؛ هرچند تغییر انتظارات درباره سیاستهای نرخ بهره آمریکا میتواند این معادله را به نفع یورو تغییر دهد.
این مطلب بخشی از مجموعه تحلیلهای روزانه رویترز درباره پیام نمودارهای مالی و سناریوهای احتمالی بازار است.